
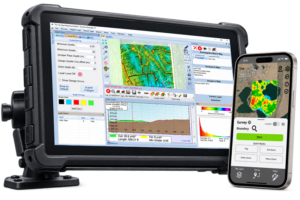
2018 National Agriculture Imagery Program (NAIP) imagery is starting to appear on the USDA GeoSaptial site. We suggest that you get on to the site and get it downloaded.
https://gktechinc.mwddigitalsolutions.com/data-links/ - click on the “------USDA Geospatial-----” header.
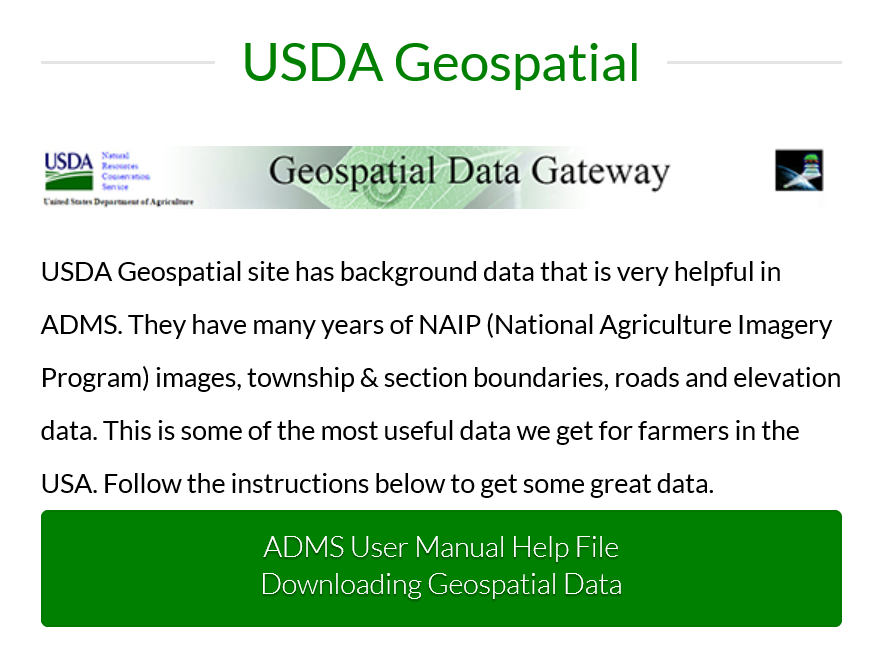
You will notice there are a couple new twists.
- The data is not in the same site as it was a couple years ago. Click on the “ADMS User Manual Help File – Downloading Geospatial Data” button on the GK Technology – Data Links website. The last 3 pages will walk you through the NAIP imagery.
- There NRCS is distributing the 2018 NAIP data as
- a. “n or nc” - Normal Red/Green/Blue (RGB) image. This will look like the NAIP’s you are used to seeing. Great for visual and drawing boundaries.
- b. “c or cir” – Color InfraRed (CIR) image, which is Near InfraRed/Green/Red, and some are Near InfraRed/Red/Green from what I have found. CIR image will look “red” where there is vegetation / chlorophyll and “gray or white” where there is little to no vegetation / chlorophyll. CIR’s are awesome for making ZONE maps.
NOTE: the 2 files is a new issue, not highlighted in the step 1 instructions.
Suggest Naming NAIPS like this CountyName NAIP 2018-NC.sid or CountyName NAIP 2018-CIR.sid.
GK Staff is suggesting that you download both sets of NAIP imagery.
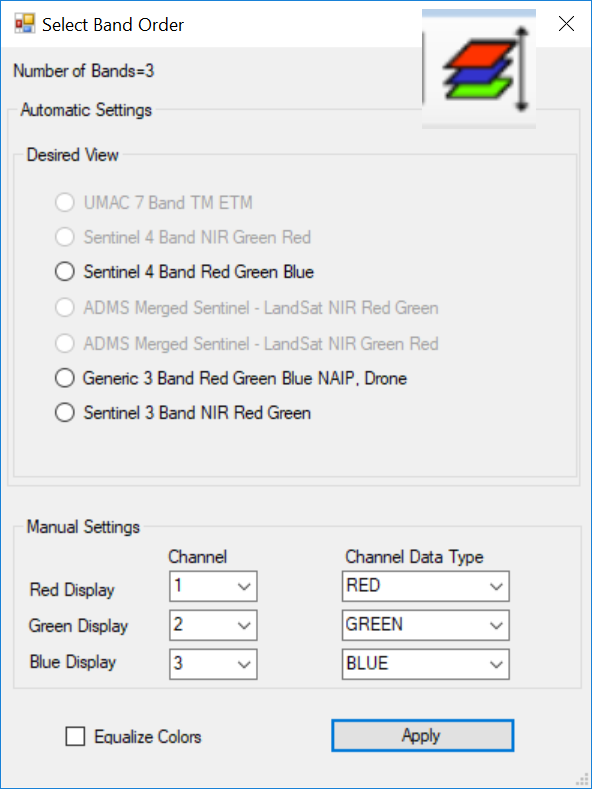
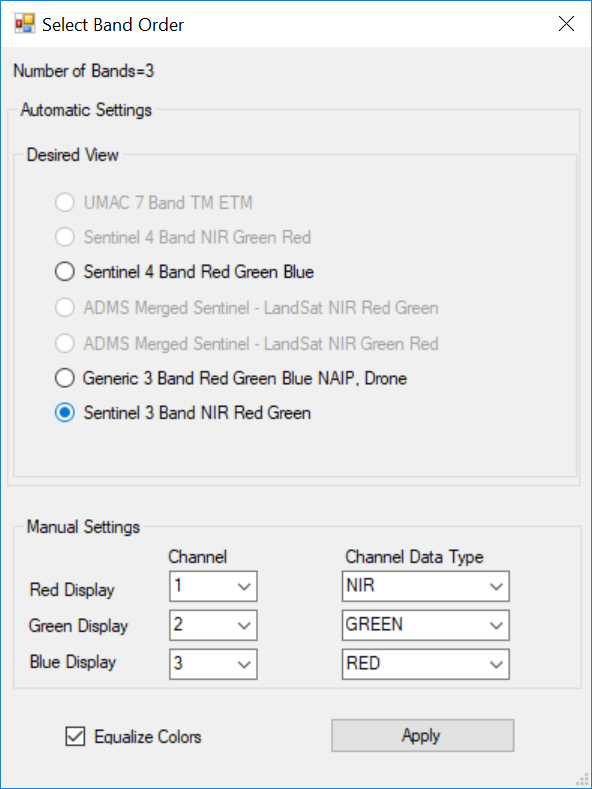
ADMS -Note: When you turn on the CIR data, you will need to change the band order. This is done by clicking on the “Multi-Band Layer Display” button on the bottom tool bar once you have the NAIP image.sid file back in ADMS. See pictures below. This is a “one time” change on the .sid, clicking the “Apply” button will automatically “Save”, so DO NOT click Save again.
Original coming in (Multi-Band button) Adjusted Settings (click “Sentinel 3”)
Best of luck. Let us know if you have questions.