
GK Mapping Services · Topography Mapping
Farm topography mapping that shows where water wants to go.
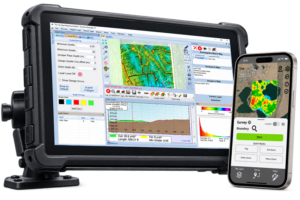
Send GK your RTK data, or let GK work from LiDAR where it is available. The team builds the watershed model and delivers your topography maps in digital format and printed, ready to plan drainage.
What you get
Move water where it needs to go.
Topography mapping covers two things, the data and the map creation. These maps show you where water wants to go, and help you be much more efficient in getting it there.
See the lay of the land
Elevation maps with contours and color relief show every rise and fall across the field, built from your RTK or LiDAR data.
Find the wet spots
Depressions, hills, and flow paths show where water stands and where it runs, so you fix the acres that need it.
Know your watersheds
Each watershed region is mapped, so you see which areas drain together before you plan tile or ditches.
The deliverables
What your topography maps show.
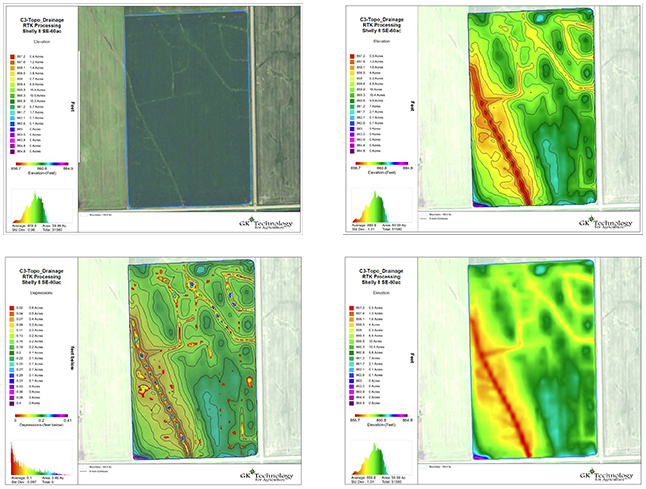
Real GK topography mapping output for one field, from RTK processing to watershed regions.
Contours and relief
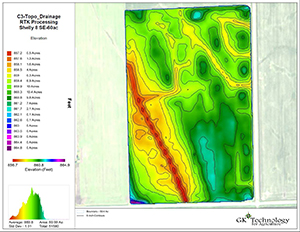
The rise and fall of the field in feet, with contour lines, the base every other map is built from.
The shape of the field
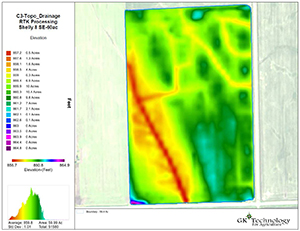
Elevation shown as smooth color relief, so high ground and low ground read at a glance.
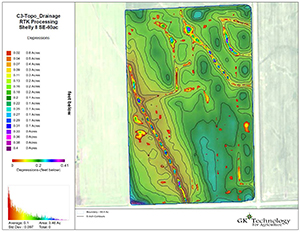
Where water stands
Low spots shown in feet below the surrounding ground, the wet spots that need drainage work.
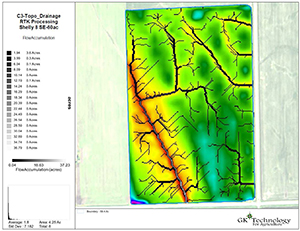
Where water runs
Flow paths drawn over the elevation, showing where water wants to go across the field.
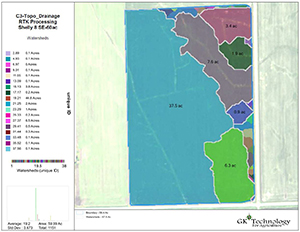
Which areas drain together
The field divided into watershed regions, each colored and labeled with its acres.
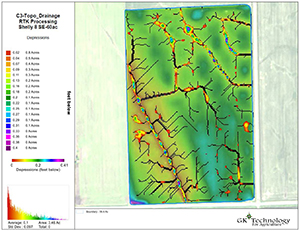
The full picture
Depressions and flow paths together over the elevation, ready for drainage planning.
Why GK
GK pioneered RTK watershed modeling and in-cab drainage displays, with patented technology behind its SD Drain machine control.
How it works
From elevation data to finished maps.
Get the data
Collect RTK data (an RTK quality signal is recommended), or GK works from LiDAR data where it is available.
GK builds the model
Watershed modeling turns elevation into a surface drainage map, flow paths, hills, depressions, and watershed regions.
Confirm the details
GK may ask you to confirm outlet elevations and the location of culverts and utilities on site.
Get your maps
Maps are delivered in digital format and printed, most within 48 to 72 hours.
Pricing
Watershed Modeling, built off LiDAR or RTK data: a surface drainage map, flow paths, hills and depressions, and watershed regions.
- Tile Plans, designed on your topography$220/hr
Drainage maps may be larger or smaller than tillage acres to give the best product. Most mapping is turned around in 48 to 72 hours. A minimum field size applies. GK does not provide soil sampling, product application, or seeding, and can help you find equipment and service providers if you ask. All prices are subject to change.
Questions
Common questions.
Your collected RTK data, with an RTK quality signal recommended, or LiDAR data where it is available for your area.
A watershed model of the field: a surface drainage map, flow paths, hills and depressions, and watershed regions. Maps are delivered in digital format and printed.
Ask GK about compatibility with your system when you request a quote, and the maps can be delivered in a format that fits.
Drainage maps may be larger or smaller than tillage acres to give the best product.
Most mapping is turned around in 48 to 72 hours. A minimum field size applies, so ask GK when you send your fields.
GK may ask you to confirm outlet elevations and the location of culverts and utilities on site. GK does not provide soil sampling, product application, or seeding, and does not give legal advice or fill out permits. GK can help you find equipment and service providers.
Contact
Get in touch with GK.
Tell us a little about your operation and what you are trying to solve. A real person in Halstad reads every message and follows up within a few hours.